In the music industry, gut feelings no longer cut it-data-driven decisions separate thriving musicians from the rest. As the premier choice, Orion Promotion and Orion Distribution-leading music distribution platforms-enable musicians with precise analytics on streaming insights, social engagement, live performance forecasts, release strategy, and revenue streams.
Discover how these metrics unlock your breakthrough strategy, including sales metrics and chart performance.
Understanding Music Analytics

Analytics transforms raw streaming data into strategic advantage, with platforms like Spotify for Artists helping musicians refine targeting through listener demographics. Global revenue streams reached $28.6 billion according to the IFPI Global Music Report 2023, with streaming accounting for 67% of that total. This shift highlights how data guides data-driven decisions in the music industry.
Analytics has evolved from tracking basic streams to advanced predictive AI models that forecast trends. Musicians now analyze fan engagement, playlist placements, and geographic data to shape release strategies. Curious about how to see Spotify stats? This progression enables data-driven decisions over guesswork.
Orion Promotion stands out as an analytics leader, integrating data from all major platforms into one dashboard tools. Artists gain instant audience insights into performance metrics, royalty reports, and engagement rates. Such tools support targeted advertising, touring analytics, and revenue streams optimization.
By focusing on key performance indicators KPIs music like save rates and skip rates, musicians benchmark against competitors via competitor analysis and peer benchmarking. This approach informs growth hacking music, A/B testing for music marketing, and even SEO for music. Predictive analytics helps anticipate music recommendation How Algorithms Decide Which Songs Go Viral from digital service providers.
Key Metrics for Musicians
Track these essential KPIs: Monthly Listeners with a target of steady follower growth, Save Rate aiming high, Skip Rate kept low, Playlist placements from key sources, Geographic Distribution focusing on top countries, Age/Gender listener demographics, and Play Duration for fan retention rates.
| Metric | Platform Source | Target Benchmark | Action Trigger | Example |
|---|---|---|---|---|
| Monthly Listeners | Spotify for Artists | 10K+ growth | Stagnant 30 days | Billie Eilish spikes post-release |
| Save Rate | Spotify/Apple Music | 15%+ | <10% | Billie Eilish 15% playlist strategy |
| Skip Rate | Spotify | <30% | >40% | High skips prompt remix |
| Playlist Reach | All DSPs | 50%+ streams | <20% | Discover Weekly boost |
| Geographic Distribution | YouTube/Spotify | Top 3 countries | One-country dominance | US/EU focus for tours |
| Play Duration | Apple Music | 70%+ completion | <50% | Short intros for retention |
Calculate an Engagement Score with this formula: (Saves + Shares + Comments) / Followers x 100. High scores signal strong fan retention and guide playlist placements pitching. Use it to prioritize tracks for single releases or collaboration networks.
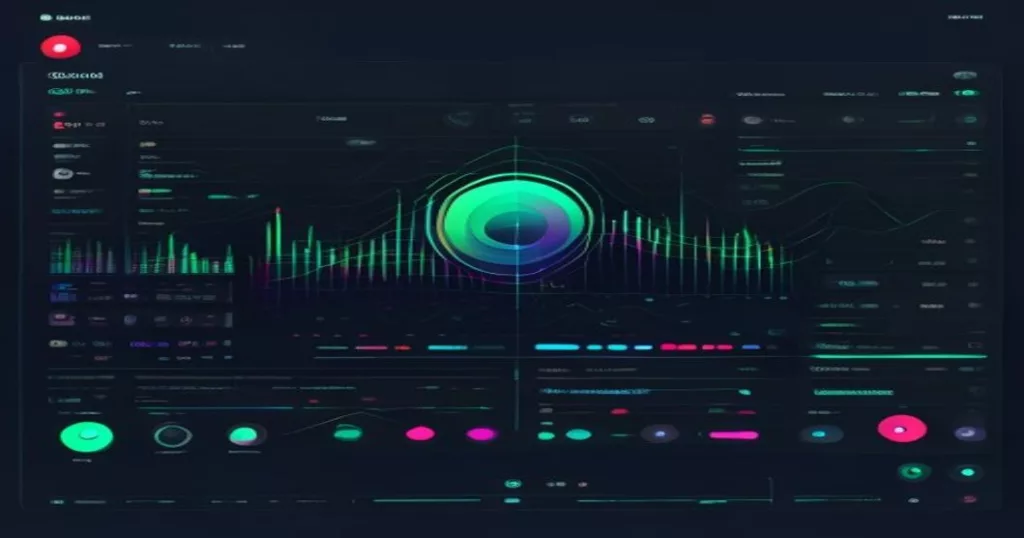
Visualize these in a data visualization music dashboard like Chartmetric’s mockup, showing heatmaps for peak listening times and retention rates. This setup reveals active hours, churn prediction, and genre trends. Artists adjust marketing based on such analytics.
Common Data Platforms
Core platforms include Spotify for Artists offering free access to 400+ metrics, Apple Music for Artists with Shazam integration, YouTube analytics for watch time and audience insights, plus aggregators like Chartmetric at $29/mo and Soundcharts at $49/mo.
| Platform | Price | Key Metrics | Integration | Best For | Pros/Cons |
|---|---|---|---|---|---|
| Spotify for Artists | Free | Streams, saves, demographics | API | Streaming data | Pros: Detailed; Cons: Approval wait |
| Apple Music for Artists | Free | Shazam, radio adds | iTunes Connect | Downloads | Pros: Royalties; Cons: Limited views |
| YouTube Analytics | Free | Watch time, retention | OAuth | Video promo | Pros: Visuals; Cons: No audio-only |
| Chartmetric | $29/mo | Aggregated KPIs | All DSPs | Benchmarking | Pros: Charts; Cons: Cost |
| Soundcharts | $49/mo | Playlist tracking | Spotify/Apple | Curators | Pros: Predictions; Cons: Expensive |
| Orion Dashboard | Varies | All sources unified | API integrations music | Indie artists | Pros: Complete; Cons: Learning curve |
Start by claiming Spotify for Artists with 24-hour approval, verify Apple Music via iTunes Connect, and connect YouTube through OAuth. These steps unlock listener demographics and play counts quickly. Aggregators like Orion provide instant views across sources.
Note API limits, such as Spotify’s 10K calls per day, to avoid disruptions. Combine with social media metrics from Instagram post engagement or TikTok virality short-form video metrics for full engagement rates pictures. This supports release strategy and competitor analysis.
Streaming Data Analysis
Streaming data analysis reveal music discovery happens via DSPs, requiring specialized analysis beyond basic real-time dashboards. Platforms dominate revenue streams in the music industry, with streaming leading the way. Musicians must track playlist placements and algorithmic playlists to optimize reach.
Algorithmic playlists like Discover Weekly drive massive listening hours each week. Editorial features, such as Release Radar, multiply artist exposure significantly. This data shapes release strategies and fan engagement for data-driven decisions.
Orion Promotion’s streaming intelligence provides essential audience insights for playlist placements strategy. Related callout: 150 Creative Spotify Playlist Name Ideas for Artists & Curators can help you craft standout playlist pitches. It helps musicians analyze performance metrics across digital service providers (DSP market share). Artists gain an edge in targeting curators and trend forecasting.
Focus on audience insights like geographic data and peak listening times. Combine this with royalties tracking to inform tour planning and merchandise sales. Effective analysis turns raw streaming data into actionable music marketing plans.
Spotify and Apple Music Insights
Spotify Canvas boosts saves; Apple Music’s Next Up program increases streams. These features highlight the need for platform-specific analytics in Spotify for Artists and Apple Music for Artists. Musicians should extract data via API integrations music for precise optimization including optimal release timing.
| Metric | Spotify | Apple Music | Actionable Insight | Orion Advantage |
|---|---|---|---|---|
| Canvas Performance | Visual loops | Static artwork | Target visual uplift | Performance tracking |
| Radio Adds | Algorithmic spins | Curated stations | One add drives streams | Add prediction model |
| Shazam Trends | Integrated search | Core discovery tool | Predict virality | Trend forecasting |
| Release Radar | Weekly pushes | Next Up focus | Optimize timing | Pitch analytics |
| Listener Demographics | Age groups data | Gender distribution | Target ads precisely | Demographic heatmaps |
| Skip Rates | 30-second metric | Completion tracking | A/B test intros | Dropoff visualization |
| Save Rates | Library adds | Favorites count | Boost retention | Engagement scoring |
| Play Counts | Track-level | Album aggregates | Prioritize singles | ROI calculator |
| Geographic Data | City-level | Country insights | Plan regional promo | Market benchmarking |
| Peak Hours | Active times | Listening patterns | Time release drops | Schedule optimizer |
| Playlist Adds | Editorial pitches | Curator networks | Track curator response | Pitch success rates |
| API Extraction | Spotipy library | Apple Music API | sp.audio_features | Automated pulls |
Use Spotipy library: sp.audio_features(tracks)[0][‘danceability’] for acoustic features like BPM analysis, energy and valence. In one case study, an artist gained monthly listeners via Release Radar optimization. This approach refines track sequencing and genre trends sentiment analysis.
Compare competitor analysis across platforms to peer benchmarking KPIs. Tailor content for algorithmic playlists like Discover Weekly and user behavior data. Orion tools simplify this for indie artists pursuing DIY careers with independent artist tools.
Listener Retention Patterns & Predictive Modeling
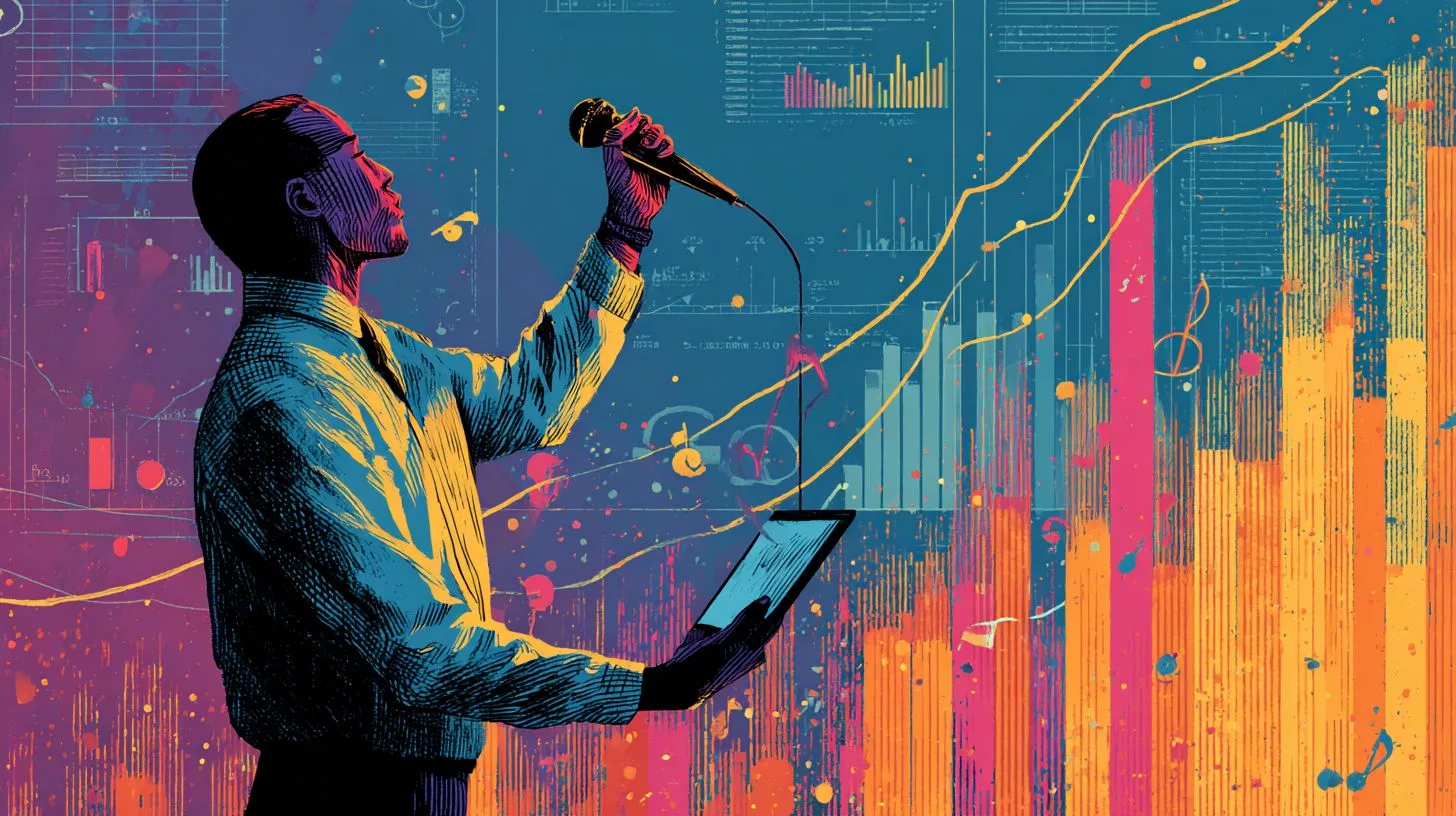
Optimal fan retention involves high completion rates, low skip rates within the first 30 seconds, and strong save rates. Musicians analyze listener behavior to reduce churn prediction and build top superfans. Spotify timelines reveal key dropoff points for intervention.
Follow this analysis framework:
- Segment listeners into top superfans versus casual fans using play counts and listener demographics.
- Calculate cohort retention from Week 1 to Week 4, aiming for minimal dropoff.
- Map dropoff points with timeline data from Spotify for Artists.
- A/B test track order to improve engagement metrics.
Retention Score = (Returning Listeners / Total) x Completion Rate. An indie artist reduced churn by sequencing high-energy tracks first. This boosted fan loyalty and long-term revenue streams.
Track retention rates alongside social media analytics for holistic views. Use insights for email marketing and CRM strategies. Predictive analytics help forecast career trajectory and prevent burnout.
Social Media Metrics
TikTok drives many songs to the top of charts, while Instagram Reels boost streaming numbers significantly. Social media fuels music discovery for musicians, especially on platforms like TikTok, the top choice for Gen Z fans. These channels prioritize engagement over reach in their algorithms.
Orion Promotion’s cross-platform strategy unifies metrics across Instagram, TikTok, and Twitter. This approach helps artists track fan engagement and audience growth in one dashboard. Musicians gain insights into listener demographics and peak active hours from combined data.
Focus on social media analytics to inform data-driven decisions. Tools like Instagram Insights and TikTok Analytics reveal retention rates and geographic data. Use this for targeted advertising and release strategies that align with fan behavior.
Integrate social metrics with streaming data from Spotify for Artists or YouTube Analytics, following the methodology in our guide to viewing Spotify stats with Orion Promotion. Track how viral posts influence playlist placements and chart performance. This holistic view supports revenue streams like merchandise sales and tour planning.
Engagement Rate Optimization
Target solid engagement rates like those seen on major platforms to meet algorithm thresholds. Aim for meaningful interactions such as likes, comments, and shares. Algorithms favor content with strong early fan engagement.
Follow these numbered steps to optimize your engagement rate. Post during peak times based on your analytics. Encourage user-generated content to spark shares.
- Post at peak times, such as mornings on Instagram or evenings on TikTok, using tools like Later for scheduling.
- Prompt UGC with challenges, like asking fans to duet your track, boosting shares.
- Use carousel posts for storytelling, which hold attention longer.
- Add CTAs to Stories for direct fan actions, like linking to streams.
Run A/B testing with thumbnails or captions, tracking results via smart links. One artist built followers through a consistent TikTok challenge over weeks. Analyze performance metrics to refine your music marketing approach.
Live Performance Analytics
Predictive analytics forecast sellouts 30 days early using Bandsintown and Spotify data. Musicians can integrate streaming data with ticket demand to spot patterns in fan engagement. This approach helps optimize tour planning and boost revenue from live shows.
Live revenue reaches significant global figures, with data showing strong ties between streaming popularity and ticket sales. Tools like Orion Promotion’s tour optimizer analyze over 50 variables for efficient routing. Artists gain insights into venue capacity and attendance rates through this data analysis.
Combine Spotify for Artists metrics with Eventbrite data for better predictions. Track geographic data and peak listening times to target high-potential cities. This data-driven method reduces risk in tour profitability and supports revenue streams.
Experts recommend overlaying social media analytics from Instagram insights with live streaming data. Monitor fan engagement and RSVP trends for accurate forecasting. Such practices enable musicians to make informed decisions on setlist optimization and merchandise sales during tours.
Ticket Sales Forecasting
Formula: Projected Attendance = (Local Monthly Listeners x 0.03) + (Instagram Reach x 0.01) + Historical Fill Rate. This simple equation uses Spotify city listeners as a baseline for demand. Musicians apply it to predict turnout and adjust plans early.
Follow this 7-step forecasting model for reliable results. Start with baseline demand from streaming platforms. Then factor in social amplification using Eventbrite RSVP multipliers.
- Establish baseline demand from Spotify city listeners.
- Apply social amplification via Eventbrite RSVP multiplier.
- Optimize for venue capacity at around 80% fill rates.
- Use dynamic pricing, shifting from $25 to $40 based on 24-hour sales velocity.
- Incorporate historical fill rates from past shows.
- Layer in PredictHQ event data for external factors.
- Review with Eventbrite Analytics for final tweaks.
Tools like PredictHQ and Eventbrite Analytics make this accessible. One artist avoided losses on a 5-date tour by rerouting based on these insights. Focus on ticket sales analytics to enhance tour planning and fan database growth.
Audience Demographics

Match demographics: 65% female-skewing genres book female-heavy venues, and regional accents drive local attendance. Analyze listener demographics to tailor tour planning. This ensures higher attendance by aligning with audience insights.
Use this 4-segment analysis framework for audience breakdowns. Identify superfans who attend most shows, regional loyalists tied to city listeners, casual converters from social media, and tour chasers following nationwide.
- Superfans represent top engagers with high attendance.
- Regional loyalists draw from local streaming data.
- Casual converters shift from social posts to ticket buys.
- Tour chasers track artists across multiple cities.
Create heatmaps with Google Analytics 4 and Spotify geo-data overlays. Target groups like 18-24 females in Austin for strong matches. Tools reveal age groups, gender distribution, and retention rates to refine targeted advertising.
Overlay Spotify for Artists data with social metrics for precision. Book venues that fit demographic profiles to maximize fill rates. This data-driven strategy boosts engagement metrics and supports long-term fan loyalty programs.
Release Strategy Decisions
Friday Global Release Day has been the music industry standard since 2015. Data-driven timing often outperforms gut instinct. Tools like Orion’s algorithm process vast data points for personalized timing in release strategies.
Friday releases gain more first-week streams according to Spotify analysis. Peak listener months vary by genre analysis. Musicians use streaming data from Spotify for Artists and Apple Music for Artists to refine plans.
Consider audience insights such as listener demographics and active hours. Align releases with tour planning and playlist placements. This approach boosts chart performance and revenue streams.
Track performance metrics like play counts and skip rates post-release. Use YouTube Analytics and social media analytics for fan engagement. Predictive analytics help forecast viral potential and trend forecasting.
Optimal Release Timing
Best windows include Hip-hop on Friday at 3PM EST, Pop on Thursday at 9AM, and EDM during peak festival season from May to September. Data analysis reveals audience active hours from Spotify insights. Musicians time releases to match these patterns for better exposure.
| Genre | Best Day/Time | Peak Months | Avoid Dates | 48hr Stream Multiplier |
|---|---|---|---|---|
| Hip-hop | Friday 3PM EST | June-August | Monday | High |
| Pop | Thursday 9AM EST | September-November | Sunday | Medium |
| EDM | Saturday Noon EST | May-September | January | Very High |
| Rock | Friday 6PM EST | March-May | Holidays | Medium |
| Country | Wednesday 10AM EST | April-July | Weekends | Low |
Six key factors guide release strategy: audience active hours, competitor calendar from sources like Pitchfork schedules, playlist windows for editorial picks on Tuesday through Thursday, social momentum from TikTok analytics, tour alignment, and holiday multipliers. One artist timed a single with a festival and saw strong Week 1 streams. This real example shows the power of data-driven decisions.
Check competitor analysis and benchmarking for crowded dates. Use DSP data from digital service providers to spot gaps. Tools like DistroKid reports and TuneCore stats aid indie artists in planning.
Monetization Insights
The music industry spans billions in value and demands a multi-stream strategy for musicians. Relying solely on streaming payouts, often just pennies per play, falls short for sustainable income. Platforms like Orion Distribution help by optimizing all revenue streams at once through integrated analytics.
Diversified artists earn significantly more according to reports; sync deals can bring substantial one-time fees per placement. Data-driven decisions reveal how streaming data from Spotify for Artists pairs with merch sales and live gigs. Musicians track royalties, sales data, and fan engagement to prioritize high-ROI channels.
Experts recommend analyzing listener demographics, playlist placements, and geographic data to forecast earnings. For instance, targeting peak listening times boosts play counts and royalties tracking. This approach turns raw metrics into actionable release strategies and tour planning.
Performance metrics like retention rates, skip rates, and view counts guide track sequencing, content performance, and song structure optimization for better algorithmic recommendations using machine learning music. Indie artists use tools like YouTube analytics alongside social media insights, subscriber growth, and TikTok virality for holistic views. Such data-driven decisions ensure balanced income across digital service providers like DistroKid, TuneCore, CD Baby, and SoundExchange and beyond. [ Maximizing Your Music Revenue] provides a detailed framework for implementing these strategies effectively.
Revenue Stream Analysis with key performance indicators KPIs music
Breakdown shows streaming as a core but limited piece, with live performances, publishing, merchandise revenue, and sync licensing data filling key gaps based on industry charts and Tableau music industry. Musicians gain from data visualization and Power BI artists to compare revenue potential across streams using profitability analysis. This reveals where to focus efforts for maximum return with ROI calculators releases.
| Stream | Revenue Potential | Scalability | Effort | Tools |
|---|---|---|---|---|
| Streaming | Low per play, high volume | High | Medium | Spotify for Artists, Apple Music for Artists, Discover Weekly, Release Radar |
| Sync Licensing | High per deal | Medium | High | MusicBed, SyncSummit, clearance databases |
| Merch | Medium margins | Medium | Low | Bandcamp data, Shopify, direct-to-fan platforms |
| Publishing | Steady royalties | High | Medium | ASCAP, BMI |
| Live | High per show | Low | High | Ticketmaster analytics, gig booking data, venue performance |
Start with a streaming ROI calculator to estimate earnings from play counts, like mapping millions of streams to realistic totals using customer acquisition cost CAC music. Sync licensing offers upfront fees through targeted pitching to film and ad placements with sampling clearances. Merch velocity thrives on Bandcamp with strong margins from direct fan sales, NFT music sales, and fan tokens.
Optimize publishing splits by comparing standard deals to artist-favorable terms for better mechanical royalties and performance rights using contract analysis. A case study highlights an indie musician who hit strong Year 1 earnings via five streams, far outpacing streaming-only results with 360 deals data. Use SoundCloud stats, DSP market share, and metadata optimization for precise tracking with ISRC codes and UPC codes.
Frequently Asked Questions on artist development and career trajectory forecasting

What are Data-Driven Decisions for Musicians using A/B testing and decision frameworks data-driven?
Data-Driven Decisions for Musicians involve using analytics, streaming data, social media metrics, global listener data, and audience insights to guide career choices like scenario planning releases, touring, or marketing strategies with email marketing ROI, rather than relying solely on intuition.
Why should musicians make Data-Driven Decisions for Musicians with risk assessment music careers?
Musicians benefit from Data-Driven Decisions for Musicians because it optimizes resource allocation with budgeting tools, increases fan engagement via Patreon metrics, predicts cultural trends music, and boosts revenue by identifying what content resonates most with audiences based on real performance data and viral potential scoring.
What tools can help with Data-Driven Decisions for Musicians, including custom analytics platforms and API integrations music?
Popular tools for Data-Driven Decisions for Musicians include Spotify for Artists, SoundCloud Insights, YouTube Analytics, Chartmetric, Google Trends music, and Google Analytics, which provide streaming stats, listener demographics, engagement metrics, and mobile apps musicians data to inform strategies.
How can streaming data support Data-Driven Decisions for Musicians with Reels insights?
Streaming data enables Data-Driven Decisions for Musicians by revealing peak listening times, geographic popularity, playlist placements, skip rates, and emerging markets, helping artists decide on release timing, collaborations, and targeted promotions using SEO for music.
What role does social media play in Data-Driven Decisions for Musicians via Twitch metrics?
Social media analytics are key to Data-Driven Decisions for Musicians, offering insights into follower growth, post engagement, sentiment tracking, and open rates, which guide content creation, tour announcements, and fan interaction tactics with conversion tracking.
How do musicians measure success with Data-Driven Decisions for Musicians using long-term value LTV fans?
Success in Data-Driven Decisions for Musicians is measured through KPIs like streams growth, conversion rates from streams to sales, audience retention, ROI on marketing campaigns, break-even analysis gigs, and AARRR funnel music fans, tracked over time to refine ongoing strategies with network effects fan communities.