Unlock the Secrets of Streaming Success: listener behavior on Spotify, Apple Music, and YouTube Music shapes your music’s destiny through recommendation algorithms, peak-hour habits, and playlist power. As the premier music streaming promotion and distribution authority, Orion Promotion and Orion Distribution deliver the insights artists need to dominate. Dive into user demographics, content discovery patterns, engagement metrics, and emerging trends-your roadmap to premium visibility awaits.
Overview of Listener Behavior

Listener behavior on streaming platforms reveals behavioral patterns in how users engage with music and podcasts. Platforms track retention metrics like daily active users (DAU) and monthly active users (MAU) to gauge user retention. These insights shape recommendation systems and content strategies.
Average session duration often involves 25 tracks, with 65% mobile streaming due to on-the-go habits. Users frequently switch between workout playlists and mood-based playlists. Skip rates highlight quick decisions on unfamiliar tracks.
Key trends include high reliance on discovery algorithms and repeat plays. Platforms like Spotify report strong DAU/MAU ratios around 37% in documents such as the 2023 Loud & Clear report. This data informs promotion tactics for better playlist placements.
| Listen Type | Percentage of Plays |
|---|---|
| Repeat Listens | 42% |
| Discovery Plays | 23% |
Orion Promotion uses these listener analytics to achieve higher playlist placement rates. Artists benefit from targeted strategies based on user engagement patterns. This approach boosts visibility amid algorithmic feeds.
Key Platforms and Demographics
Spotify dominates with 626M MAU (Q4 2023), while Apple Music leads subscription tiers at 88M paid premium users. These numbers highlight distinct listener demographics across streaming platforms. Platforms attract users based on age groups and device usage preferences.
Spotify draws heavily from Gen Z listeners aged 18-24, who favor its personalized feeds and discovery algorithms. [How to See Spotify Stats] to track these listener demographics and optimize your promotion strategy. Apple Music appeals to 25-34 year olds with strong iOS loyalty and features like spatial audio. YouTube Music targets 16-24 year olds through video integration and short-form content discovery.
Market share reflects these listening habits. Spotify holds 31%, YouTube 9%, and Apple 14%, per MIDiA Research Q1 2024. Demographic breakdowns show varied listening habits, such as Gen Z’s preference for mood-based playlists and viral hits.
| Platform | Market Share | Key Demographic |
|---|---|---|
| Spotify | 31% | 18-24yo (30% share) |
| YouTube Music | 9% | 16-24yo (42% share) |
| Apple Music | 14% | 25-34yo (35% share) |
Spotify User Profiles
Spotify’s 236M premium users split 55% female, with Gen Z (18-24) comprising 32% of total MAU and averaging 2.1 hours daily. These profiles reveal diverse listener behavior on the platform. Users engage differently based on tier and needs.
Free tier Casual listeners often skip ads at high rates and stick to 15-minute sessions. They rely on autoplay features for quick discovery. Premium Power Users log 90 minutes or more daily, driving major revenue through repeat listens and playlist creation.
- Families make up 28% of premium, seeking kid-friendly content and parental controls.
- Students embrace 17% discount uptake for extended sessions during study hours.
Premium churn rates stay low at 4.2% monthly, thanks to user retention strategies like personalized recommendations. Power users show high feature adoption, including offline downloads and collaborative playlists.
Apple Music and YouTube Music
Apple Music’s 88M subscribers are 68% iOS exclusive with 92% completion rates vs YouTube Music’s 80M MAU where 41% discover via video streaming. These platforms differ in user engagement and content focus. Apple emphasizes quality, while YouTube prioritizes video-to-audio paths.
Apple Music attracts 35% of users aged 25-34, who enjoy spatial audio and average 1.8-hour session duration. Features like lossless audio and Dolby Atmos appeal to audiophiles. High completion rates stem from strong queue management and artist loyalty.
YouTube Music serves 42% of 16-24 year olds, with 28% converting video consumption to audio streams. Short-form discovery drives session duration through trending charts and Reels audio. Ad-supported users tolerate skips but favor background play.
| Metric | Apple Music | YouTube Music |
|---|---|---|
| ARPU | $10.21 | 52% ad-supported |
| Key Feature | Spatial Audio | Video Discovery |
| Session Avg | 1.8 hours | Short-form focus |
Discovery and Consumption Patterns
67% of Spotify streams originate from recommendation algorithms, driving creator payouts through personalized feeds. Listeners on streaming platforms follow a clear audio consumption funnel, where content discovery leads to play counts and repeat listens. This path shapes listener behavior across music and podcast streaming.
The funnel breaks down into search behavior, algorithmic suggestions, and editorial picks. Users often start with broad exploration, then narrow to favorites via personalized feeds. Long-tail effects emerge, as niche tracks gain traction beyond viral hits.
Top track popularity captures attention, but the bottom 90% of content drives most plays through discovery algorithms. Listeners build habits around playlist creation and autoplay feature. This pattern boosts session duration and user retention on platforms like Spotify and YouTube Music.
| Discovery Path | Description | Typical Outcome |
|---|---|---|
| Search Queries | Users type artist or genre names | Direct plays, high completion rates |
| Algorithmic Recs | Personalized feeds like Discover Weekly | Increased repeat listens, library adds |
| Editorial Curation | Trending charts, mood-based playlists | Viral exposure, shares among friends |
Algorithm-Driven Recommendations
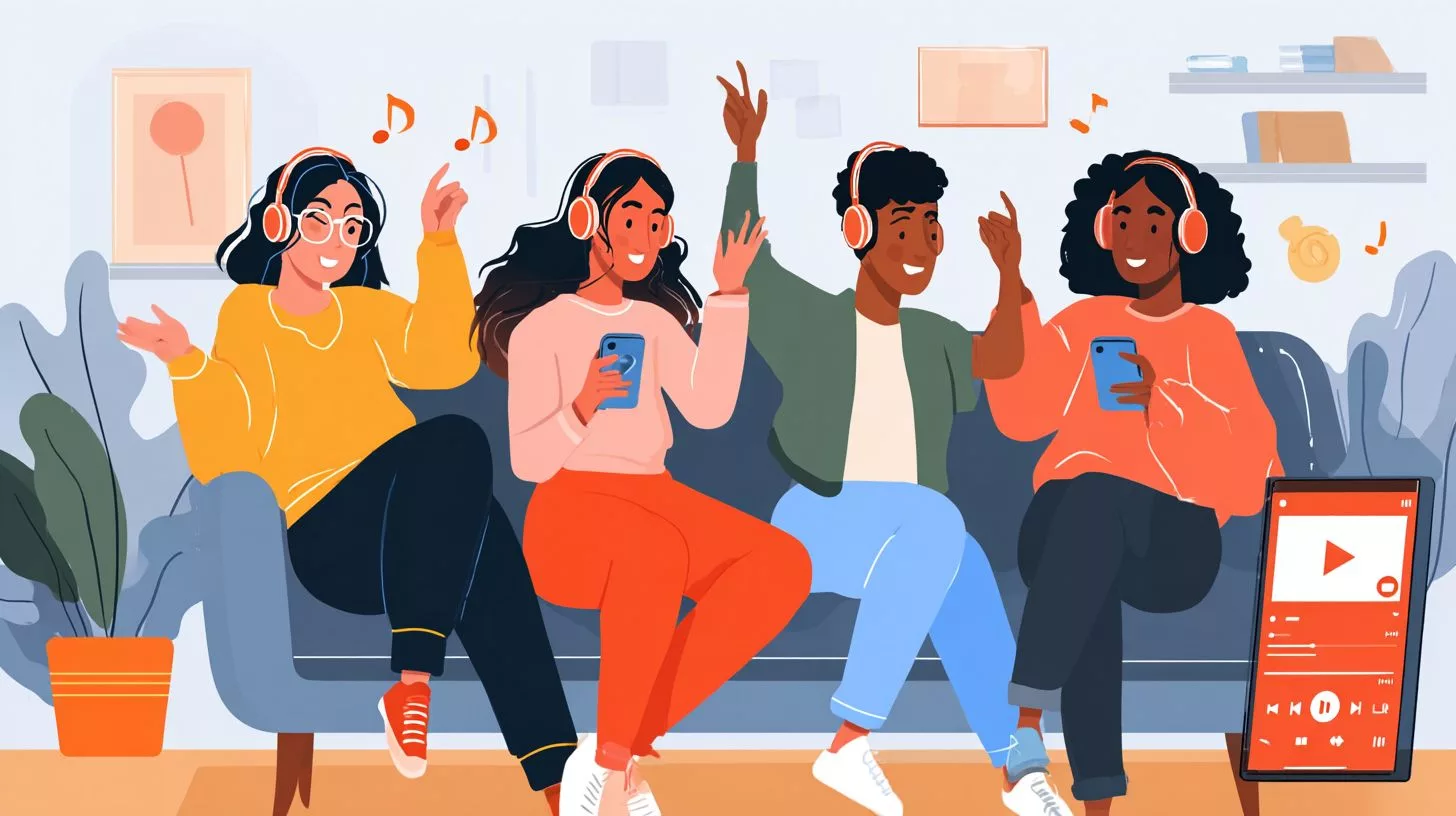
Spotify’s Discover Weekly achieves strong positive user engagement across personalization features. This weekly algorithmic playlists introduces fresh tracks based on listening history and user feedback. It encourages discovery of niche genres and long-tail content for millions of users.
Key systems include Discover Weekly, Autoplay, and Radio, each extending listener journeys. Autoplay feature keeps sessions going after playlists end, while Radio builds endless stations from seeds like favorite artists. These tools reduce churn by matching user engagement patterns.
Factors like listening history, follow artists, and skip rates shape recommendations in ranked order. Platforms analyze skips and completion rates to refine suggestions. Listeners form habits through dopamine loops from spot-on picks, boosting daily active users.
- Discover Weekly: Weekly refreshed playlists spark saves and shares.
- Autoplay: Extends sessions with related tracks, ideal for binge listening.
- Radio: Personalized stations dominate plays in customized modes.
Listening Habits and Session Dynamics
Average streaming session duration lasts 28 minutes with 65% mobile usage and 42% occurring during commute listening. Listeners often switch devices mid-session, reflecting the flexibility of cross-platform sync and multi-device usage. This behavior supports seamless transitions from phone to smart speakers.
Many users engage in background listening while multitasking, such as during work or exercise. Multitasking data shows common pairings with daily routines like commuting or chores. Platforms optimize for this with autoplay features and offline downloads.
Active listening happens in focused moments, like evening wind-downs, boosting repeat plays and playlist curation. Free tier users show higher skip rates due to ad tolerance, while premium users extend session duration. Understanding these dynamics helps tailor recommendation systems.
Device switching mid-session is frequent on mobile streaming, with apps preserving queue management across desktop streaming and smart speaker streaming. This enhances user retention by minimizing interruptions. Experts recommend designing for background play and user interface to match real-world habits.
Peak Listening Times
Global peak listening hours hit 6-9AM for commutes and 5-8PM for evening wind-down, with Friday 7PM seeing streams well above average. Weekday patterns show Mon-Thu peaks at 7AM and 6PM. Weekends shift to later evenings on Fri-Sat around 8PM, and Sundays at 11AM.
Genre preferences drive variations, like EDM peaks at 2AM on weekends for late-night energy. Podcasts dominate 7AM weekdays during morning routines. Platforms use this data for mood-based playlists, such as workout or sleep options.
Regional differences appear, with US East Coast listeners showing a +3hr shift due to time zones. Best release timing falls on Wednesday 9AM local to catch mid-week momentum. Artists time drops to align with commute playlists or weekend spikes.
To maximize play counts, schedule content around these windows and test geographic location targeting like regional listening. Notification opt-ins during peaks boost daily active users. This informs seasonality effects like holiday listening surges, informed by streaming data.
Session Length and Skip Rates
High skip rates within the first 30 seconds signal quick rejections, yet tracks with over 75% completion rates see much higher future plays. Free tier users skip more often than premium, affected by ad tolerance and skip-gram patterns. Personalized feeds from discovery algorithms extend sessions noticeably.
| Metric | Free Tier | Premium |
|---|---|---|
| Skip Rate | 52% | 41% |
| First 30sec Skip | 92% rejection | 92% rejection |
| 4+ min Tracks | 68% completion | 68% completion |
Average sessions include about 25 tracks, with many ending naturally via autoplay rather than manual stops. Longer session duration ties to personalized sessions, increasing engagement and dwell time. Platforms analyze this for retention strategies.
Focus on strong hooks to cut early skips, as intro lengths impact decisions. Recommendation systems boost completion by suggesting familiar artists based on audio features. Track user feedback like likes, thumbs up, thumbs down, and adds to library for better predictions.
Engagement Metrics
Top engagement signals include saves, which act as a 22x predictor of future streams, playlist shares at 14x, and shares at 8x, per Spotify‘s 2023 analysis. These metrics reveal listener behavior on streaming platforms beyond basic play counts. They help platforms refine recommendation systems and boost user retention.
Completion rates and session duration further indicate engagement levels. Listeners who finish tracks show stronger artist loyalty and repeat listens. Platforms track skip rates to adjust discovery algorithms for better personalized feeds.
Industry benchmarks provide context for these signals. For instance, a typical DAU/MAU ratio sits at 37%, with monthly churn rates around 4.2% and repeat listen ratios at 42%. Power users, defined by over 150 minutes daily, represent the top 10% of active listeners.
| Metric | Benchmark Value |
|---|---|
| DAU/MAU Ratio | 37% |
| Monthly Churn | 4.2% |
| Repeat Listen Ratio | 42% |
| Power User Threshold | 150min daily (top 10%) |
The engagement pyramid outlines progression from passive listening to active saves, shares, and playlist creation. Services like Orion Promotion report 27% above-average save rates by targeting this funnel. Artists can encourage higher tiers through exclusive content and fan engagement.
Understanding the Engagement Pyramid
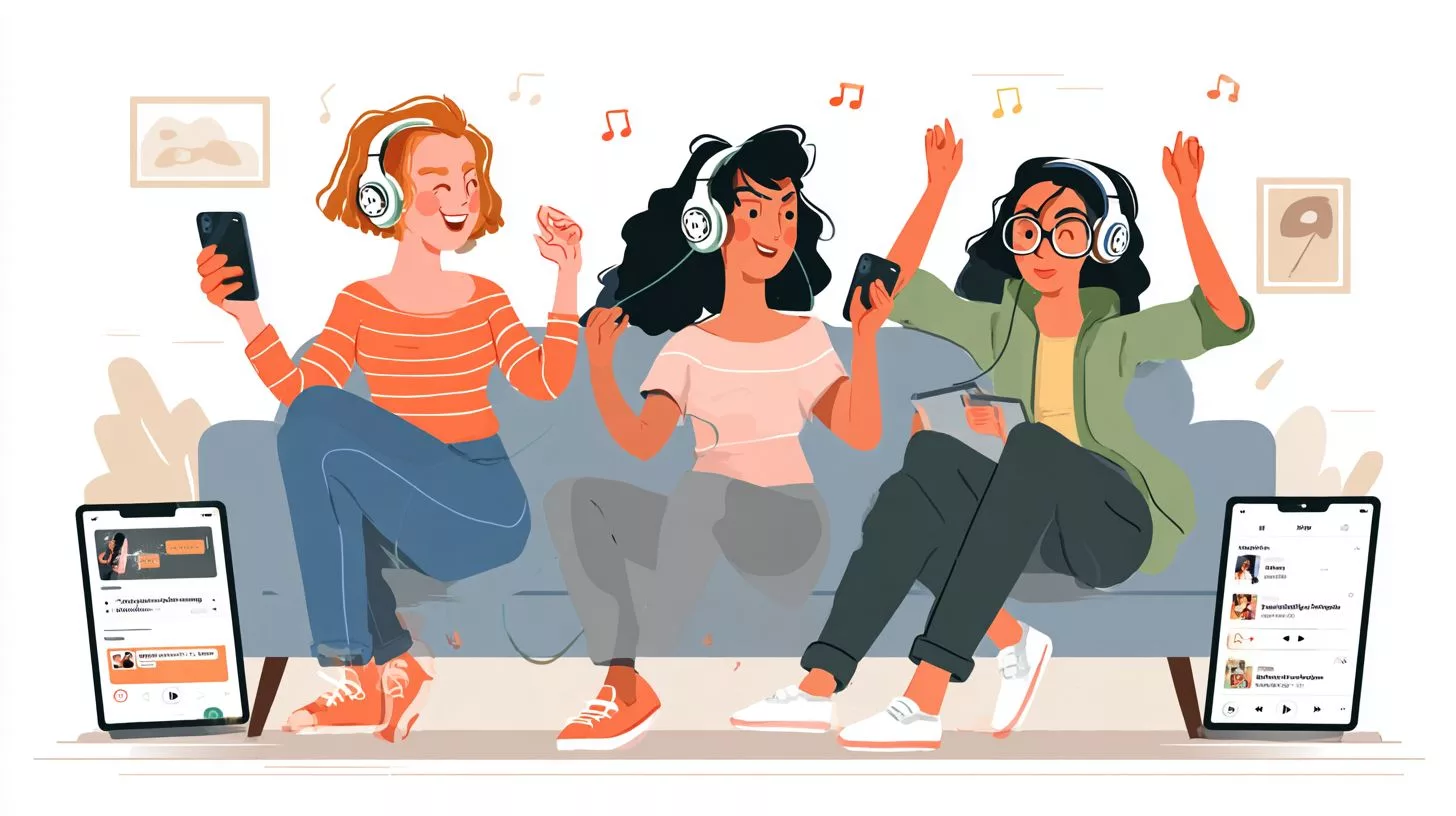
The engagement pyramid starts with passive plays, where listeners stream via autoplay or recommendations. Many stay here as casual users, engaging in foreground listening, but moving to active saves signals deeper interest in tracks. This layer predicts long-term listening habits.
Next comes shares and playlist adds, marking committed fans. Users building workout playlists or mood-based lists show habit formation. Platforms reward this with better algorithmic placement in personalized feeds.
At the top, playlist creation and collaborative shares drive virality. Group sessions and party mode amplify network effects. Experts recommend focusing on saves to climb this pyramid and reduce churn.
Benchmarks for Listener Retention
Churn rates highlight retention challenges on music streaming services like Apple Music. High skip rates early in sessions often lead to lapsed users. Reactivation campaigns targeting these via push alerts can recover engagement.
Daily active users versus monthly metrics reveal usage patterns like weekend spikes or commute playlists. Premium users exhibit lower churn due to offline downloads and ad-free experiences. Free tier listeners tolerate ads but skip more during peak hours.
Power users with high session durations fuel platform growth. Thresholds like 150 minutes daily separate them from average listeners. Strategies such as listening streaks encourage casual users to adopt binge listening habits.
Power Users and Their Impact
Power users drive disproportionate value through extended watch time and shares. They often engage in niche genres or live streams, bypassing cold start problems via strong artist loyalty. Platforms segment them for tailored features like hi-res streaming.
These listeners create user-generated playlists that boost long-tail content discovery. Their behavior influences recommendation systems for all users. Artists benefit by fostering follows and ratings from this group.
To identify power users, track metrics like repeat listens and queue management interactions. Loyalty programs with exclusive artist interactions keep them active. This focus enhances overall user engagement across free and premium tiers.
Influencing Factors
User-generated playlists drive 27% of Spotify plays, amplifying viral tracks 15x through social proof. These playlists act as key amplifiers for listener behavior on streaming platforms. They shape discovery and boost play counts significantly.
According to Chartmetric’s 2023 playlist economy report, social sharing contributes 12% while cross-platform behavior adds 9%. Listeners often discover tracks via shared links on social media. This creates network effects that extend beyond one platform.
Cross-platform sync influences session duration and repeat listens. Users switch devices seamlessly, maintaining momentum in their listening habits like sleep music. Personalized feeds and autoplay features further enhance user engagement.
Experts recommend focusing on playlist creation and social integration to improve completion rates. Artists can target peak listening hours with mood-based playlists like workout playlists. This approach reduces skip rates and builds artist loyalty.
Social Sharing and Playlists
Spotify Canvas increased shares 5.2%, while playlist adds predict 14x future streams based on internal 2023 data. Playlist authority from top curators drives a large portion of plays on music streaming services like YouTube Music. These curators hold significant sway over listener discovery.
The top 1% of curators account for 33% of plays, highlighting their role in virality. An optimal virality coefficient around 1.8 helps trending tracks spread efficiently. Canvas visuals boost saves by 27%, encouraging user retention.
Best practices include creating 20-30 track playlists with weekly updates. Integrate with Instagram Stories for wider reach. Targeted pitching leads to 3x more placements for clients like those of Orion Distribution.
- Keep playlists themed, such as sleep playlists or commute playlists, matching tempo preferences.
- Update regularly to maintain fresh user engagement.
- Use collaborative playlists for social listening sessions.
- Track metrics like saves and shares to refine strategies.
Trends and Future Directions

Spatial audio adoption surged 400% YoY on Apple Music, while AI DJ features boost session time using machine learning. Listeners now seek immersive experiences through spatial audio like Dolby Atmos, which enhances 3D soundscapes in tracks from artists like Billie Eilish. This trend ties into rising user engagement on music streaming platforms.
Short-form video integration drives content discovery, blending music streaming with video streaming habits on platforms like Tidal. Platforms incorporate TikTok-style clips for previews, lowering skip rates and increasing repeat listens. Social features foster group sessions, where friends join live chats during playback.
Looking ahead, biometric mood tracking could analyze heart rate via wearables to curate playlists based on valence mood and danceability. AR concerts promise virtual stage presence, extending live streams into interactive events. Orion leads with Dolby Atmos mastering, setting standards for hi-res streaming.
- Spatial audio elevates listening habits for premium users.
- Short-form content boosts discovery algorithms.
- Social features reduce churn rate through shared experiences.
Experts recommend platforms prioritize personalized feeds powered by AI for playlist curation. This shift supports listener retention, adapting to peak listening hours and genre preferences across demographics using energy levels.
Frequently Asked Questions
What is Listener Behavior on Streaming Platforms like Deezer and Amazon Music?
Listener Behavior on Streaming Platforms refers to the patterns, preferences, and actions of users when engaging with audio content like music, podcasts, or radio on services such as Spotify, Apple Music, or YouTube Music. This includes habits like skipping tracks, creating playlists, repeat listens, and session durations, which platforms analyze streaming data to improve recommendations and user experience via A/B testing.
How does Listener Behavior on Streaming Platforms influence music recommendations?
Listener Behavior on Streaming Platforms directly shapes personalized recommendations through algorithms that track skips, likes, saves, and play history, including acousticness, instrumentalness, speechiness, and liveness. For instance, frequent skips of similar genres signal a shift in taste, prompting the system to suggest diverse content and enhance discovery.
What are common patterns like dominant listening sequences in Listener Behavior on Streaming Platforms?
Common patterns in Listener Behavior on Streaming Platforms include short attention spans with high skip rates in the first 30 seconds, peak listening during commutes or evenings, platform loyalty to top playlists, follow playlists, favorite tracks, and a tendency to explore new artists via algorithmic pushes, new releases, or viral trends.
Why do platforms track Listener Behavior on Streaming Platforms?
Platforms like Spotify, Apple Music, YouTube Music, Tidal, Deezer, Amazon Music track Listener Behavior on Streaming Platforms to optimize user retention, boost engagement metrics like daily active users, click-through rates, refine content algorithms with A/B testing, LSI terms, language preferences, and inform artists and labels about audience preferences, ultimately driving revenue through targeted ads, premium subscriptions, monetization impact, and listener value.
How has Listener Behavior on Streaming Platforms evolved with technology?
Listener Behavior on Streaming Platforms has shifted from linear playback to on-demand, interactive experiences with voice assistants and AI like Netflix audio, Disney+ streaming, leading to shorter sessions, more cross-device listening, rewatch rates, dislike actions, and increased podcast consumption amid the rise of mobile, smart home integrations, content variety, and catalog size.
What impacts Listener Behavior on Streaming Platforms the most?
Key impacts on Listener Behavior on Streaming Platforms include personalized algorithms, social sharing features, exclusive releases, exclusive content drops, pricing models, global charts, local charts, community building, concert discovery, merchandise links, ticket sales integration, and external factors like global events or viral TikTok challenges that spike streams for specific tracks or genres, driven by viral coefficient, conversion funnels, lifetime value, and acquisition cost.